CHAPTER I – INTRODUCTION
The Government has accorded high priority to the development of social sector and for
this purpose a number of flagship programmes are being implemented to build the social infrastructure, especially in the area of education. However, in the absence of an effective institutional mechanism, the statistics reflecting the outcomes of these
initiatives of the Government become available only after a considerable time lag and with a number of limitations.
In view of this an effective institutional system was needed to be evolved to get the
timely and quality data on the progress achieved in the social sector including
education sector, which is having implications for human development. So, M/o
Human Resource Development (MHRD) initiated an All India Survey on Higher
Education to build a database and to assess the overall picture of higher Education in the country. Database is also required to develop strategic indicators against various
goals that clearly identify what would be measured. Monitoring of achievement of
targets, annual and cumulative, may also be done on the baseline data.
1.1 Constitution of Task Force: A Task Force was constituted with representations from various stake‐holders such as Ministry of Human Resource Development
(MHRD), University Grants Commission (UGC), All India Council for Technical
Education (AICTE), Medical Council of India (MCI), Indian Council of Agricultural
Research (ICAR), Central Statistics Office (CSO), Universities, State Higher Education
Departments to conceptualise the Survey and to provide technical guidance. The
notification on constitution of the Task Force and its Terms of Reference is given at
Annexure‐1.
1.2 Identification of Institutions for Coverage–The Institutions have been classified in following 3 broad categories
- University & University Level Institutions i.e. the Institutions which are empowered to award degree under some Act of Parliament or State Legislature.
- Colleges/Institutions which are not empowered to provide degree in its own name and therefore are affiliated/recognised with Universities.
- Stand‐alone institutions (not affiliated with Universities) which are not empowered to provide degree and therefore run Diploma Level Programmes. During 2010‐11 survey, 5 types of such Institutions have been covered. These are, (i) Technical such as Polytechnics & (ii) Post Graduate Diploma in Management recognised by AICTE (iii) Teacher Training such as District Institute of Education & Training recognized by National Council for Teacher Education (iv) Nursing Institutes recognized by Indian Nursing Council and (v) Institutes directly under the control of various Central Ministries.
1.3 Formulation of Concepts & Definition and Instruction Manual: All the terms generally used in higher education such as University, college, programme, discipline, faculty, department have been clearly defined in the instruction manual, which also includes item‐wise instructions to fill the forms. Concepts and Definitions used in the survey are given at Annexure‐2.
1.4 Preparation of Core List of Higher Education Institutions – The first and most
important and phenomenal task was to compile the core list of Institutions of higher
learning. There are numerous players in this field, which are not easily identifiable.
Listing of institutions was one of the major components as exhaustive list of all the
Institutions of higher learning in the country was not available. The list of all the
Universities and the Stand‐Alone Institutions has been prepared by adopting the
following method:
‐ Consulting the websites of the State Government Departments, Ministries
and Institutions.
‐ Consulting all the Central Ministries, Councils and State Governments for
providing the list of Institutions under their control.
Different colleges are regulated with different regulatory bodies. There are some
colleges whose programmes are recognized by more than one regulatory body. To
avoid duplication or omission, University was identified as the best source to prepare
the list of colleges. Thus, the College list was dynamically generated through
University during the survey. Software was designed in such a manner that as soon as
the university uploaded its form on the server, college list was automatically populated
in the data‐base.
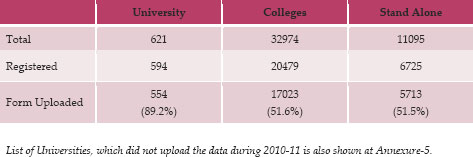
A list of 621 Universities and 11095 Stand Alone Institutions has been prepared after
updating it during the survey by obtaining updated list from State Nodal Officers.
Although the List of Stand Alone Institutions is almost exhaustive, it is still not firm as
States are still revising it. Colleges list was prepared through University and a list of
32974 colleges has been generated from the 225 affiliating Universities which have
uploaded the form on the portal. It was found during the survey that some of the Universities have listed those colleges also which have actually been shifted to some
newly created universities or set up after 2010‐11. This has led to a few cases of
duplication and inclusion of a few colleges, which were not in existence during 2010‐11.
There were 7 affiliating universities which did not upload the form and therefore their
colleges’ list could not be generated. Thus the college list does not include the colleges
affiliated with these 7 universities.
1.5 Partner Agencies ‐ A core team of officers from MHRD and UGC was involved in providing technical support, which includes preparation of DCF, providing training in workshops, assisting National Informatics Centre (NIC) in software development etc. National University of Educational Planning and Administration (NUEPA) was entrusted with the responsibility of providing the administrative support. The software support was provided by NIC. Several regulatory authorities also took part by instructing their institutions for providing information in the survey. Nodal officer has also been appointed in each State to coordinate the survey work. Most of the States have nominated Higher/ Technical Education department as Nodal department/ agency for coordinating the Survey. However, Chandigarh, Jharkhand, Kerala, Odisha, West Bengal and Puducherry have engaged agencies/ Department other than Higher/ Technical Education Department. Andaman & Nicobar Islands, Lakshadweep, Dadra & Nagar Haveli, Jammu & Kashmir did not appoint any nodal Department and therefore the work in these States was directly coordinated by MHRD. Along with State nodal officers, 3 more nodal officers, one each from Directorate of Technical Education (for Polytechnics), SCERT (for DIETs and Teacher Training diploma level institutions) and State Nursing Council have also been appointed to coordinate with Standalone Institutions. The names of these nodal officers are shown at Annexure‐3.
1.6 Mode of Survey ‐ A dedicated portal (http://aishe.gov.in) has been developed with the help of National Informatics Centre (NIC) for collection & compilation of the data. All the Institutions need to register on the portal for accessing the portal and uploading its data. The registrations of the Institutions are approved by appropriate level of officers at State/ Central Level and in case of colleges, by University nodal Officers. The e‐version of DCF has been prepared in such a manner that it expands according to the structure/size (Number of Faculties/ Departments, Programmes, etc.) of the Institution. The Data Capture Format is downloaded from the portal, filled offline and then filled‐in DCF is uploaded, which has made it completely paper‐less. DCF has been designed in such a manner that no manual aggregation is required at any level. No investigator is sent to the Institution to collect the data. In fact the nodal officers appointed by the Institutions themselves are the Investigator and they are responsible for filling up the DCF and uploading it on the portal. This eliminates the duplication of effort in data entry once form is uploaded by the Institution. Once data is uploaded by the Institutions, data compilation is done automatically in pre‐designed formats. One unique feature is that the filled in DCFs are always available on the portal, which can be seen by the Institutions and higher level authorities and can be modified, whenever required, till survey is closed.
1.7 Duration of the Survey ‐ Main Survey started in the month of August, 2011. After testing the software in the field, during the initial 2‐3 months, the survey started in full swing in the month of October, 2011 and continued till 06.05.2013. In between Survey for the year 2011‐12 was also launched on 21.03.2013, with one of the special features that data, such as basic details, name of faculties/departments and list of programmes can be pre‐filled in future survey DCF from the previous filled in DCF with an option to edit pre‐filled data.
1.8 Institutions Uploaded Data under Survey – During AISHE 2010‐11, 554 Universities uploaded the data on the portal out of which 225 had affiliated & constituent colleges, 32974 in number. 17023 colleges, including constituents units/offcampus centres/recognised centres of Universities, have uploaded the form on the portal. As regard to Stand alone Institutions, 5713 have uploaded the duly filled‐in form.
State‐wise progress is given at Annexure‐4. All India Summary is given below:
2.1 NUMBER OF INSTITUTIONS
2.1.1 University
During 2010‐11, list of 621 Universities were prepared and they were requested to
upload the data. The state‐wise number of universities with types is shown in Table‐1.
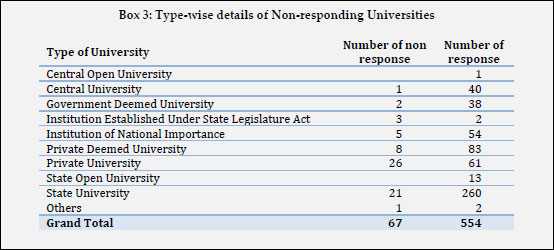
The type‐wise details of the 621 Universities are given below. Out of them, 554
Universities uploaded the data during AISHE 2010‐11. The names of remaining
Universities, which could not upload the data, are listed in Annexure‐5.
 |
 |
Among 621 Universities, 178 are privately managed. 200 Universities are located in rural area. 7 Universities are exclusively for women, 2 in Tamil Nadu and 1 each in Andhra Pradesh, Haryana, Karnataka, Maharashtra and Rajasthan.
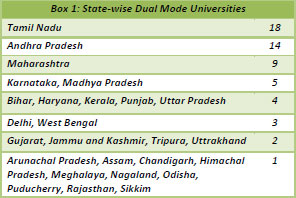
In addition to 1 Central and 13 State Open Universities, there are 95 Dualmode Universities, which offer education through distance mode.Out of 95 Dual mode Universities the most are in Tamil Nadu. Among major states, in Jharkhand, neither there is any Open University nor any Dual Mode University. The state‐wise details are given in the Box 1.
Among specialised Universities, the maximum are Technical Universities. The distribution among different specializations is shown in the Figure 1.> 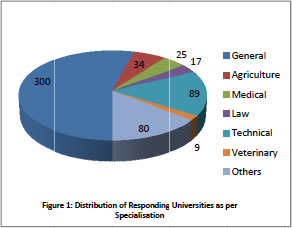 State-wise distribution of Universities as per specialisation is shown in Table-2.
In 15 States/ Union Territories, namely, Arunachal Pradesh, Assam, Bihar, Chhattisgarh, Goa, Gujarat, Haryana, Karnataka, Kerala, Maharashtra, Manipur, Mizoram, Nagaland, Odisha, Tripura, all the Universities uploaded the data. In 4 Union Territories namely Andaman & Nicobar Islands, Dadra & Nagar Haveli, Daman & Diu and Lakshadweep, there are no Universities.
Among the non-responding universities mostly were private universities, approximately 30%. All the Central Universities under MHRD, Indian Institutes of Technology, Indian Institutes of Information Technology and National Institutes of Technology uploaded the data. All the 14 open Universities also uploaded the data. Indian Maritime University, Tamil Nadu, was the only Central University, which could not upload the data. There are 225 affiliating Universities. Apart from these, there are 7 more such Universities, which have not uploaded the data and have affiliated colleges as per the UGC.
Only affiliated and constituent institutions of Central and State Universities have been counted as colleges. Constituent units of deemed/private universities, Off-campus centres and Recognised centres have not been counted as Colleges. There are 225 affiliating Universities and these have 32974 colleges. There are 7 more affiliating Universities, which did not upload the data. There are 14 Universities, which have 500 or more colleges. The number of Universities among different ranges of colleges is shown in the Box 4. Rajasthan University has the maximum number of colleges (990).
1. Sidou Kanhu Murmu University, Dumka, Jharkhand (17)
2. Rajasthan University of Health Sciences, Jaipur, Rajasthan (231)
3. Tamil Nadu Dr. M.G.R. Medical University , Chennai, Tamil Nadu (290)
4. Gautam Buddh Technical University, Lucknow, Uttar Pradesh (618)
5. Mahamaya Technical University, Noida, Uttar Pradesh
6. Uttaranchal Sanskrit University, Hardwar, Uttrakhand (47)
7. North Bengal University, Darjeeling, West Bengal (84)
Number in parentheses shows approximate number of colleges, according to UGC.
There are wide variations in number of colleges per state and also per district. Top 10 districts and number of colleges in those districts are shown below. In these 10 districts almost 14% colleges are located. Top 50 districts have about 40% of colleges. Number of districts in different ranges of number of Colleges is shown below. State-wise number of districts in different ranges of number of colleges is given at Table-3.
|
|
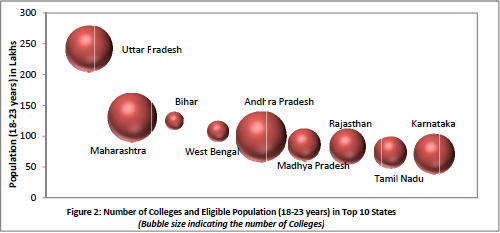 India average of 23. The top 6 States in terms of highest number of colleges in India
 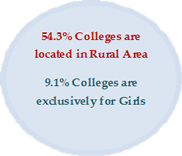 are Andhra Pradesh, Maharashtra, Uttar Pradesh, Karnataka, Rajasthan and Madhya Pradesh and out of them all States have more than 23 colleges per lakh population except Uttar Pradesh. In Andhra Pradesh, there are 4780 colleges and for every one lakh population there are 48 colleges. Similarly, Maharashtra comes close second with 4512 colleges and 35 colleges per lakh population which is lower in comparison to the ratio of A.P. In U.P. there are 4049 colleges but the colleges per lakh population are only 17 which make the ratio of U.P. the lowest in these top 6 States. Karnataka on the other hand has the highest ratio with 3098 colleges in all and 44 colleges per lakh population. Rajasthan is fifth with 2435 colleges and 29 colleges per lakh population. M.P. lastly has 2009 colleges and 23 colleges for every one lakh persons. State-wise list of number of colleges and the density are shown in Table 4.
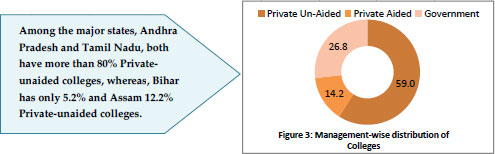
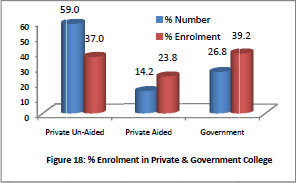
2.1.2(a) Management-wise number of Colleges
Majority of the Colleges, (73%) are privately managed. Out of which, 59% are Private-unaided and 14% are Private-aided. Remaining 27% are Government colleges. State-wise, Management-wise distribution of Colleges is shown in Table-5. There are wide variations among states in number of private colleges.
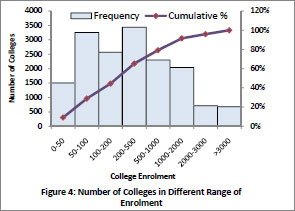
2.1.2(b) Size of Colleges
Majority of colleges are smaller in terms of enrolment. 30% of the Colleges are having enrolment less than 100 and 36% of the colleges have student strength 100 to 500 which means 66% of the colleges enroll less than 500 students. Only 4% Colleges have enrolment more than 3000.
| Cumulative Number Colleges in Different Range of Enrolment | ||||||||||||||||||||||||||||
|
 |
|||||||||||||||||||||||||||
2.1.3 Stand Alone Institution
Stand Alone Institutions can be categorised into 5 categories as described below:
Type I- Diploma Level Technical Institutes such as Polytechnics, which are generally recognised by All India Council for Technical Education (AICTE) and administered by State Directorate of Technical Education.
Type II- Diploma Level Teacher Training Institutes including District Institute of Education & Training (DIETs) recognised by National Council for Teacher Education (NCTE) and generally administered by State Council for Education Research & Training (SCERT).
Type III- Diploma Level Nursing Institutes recognised by Indian Nursing Council (INC) and generally administered by State Nursing Council/Boards.
Type IV- PGDM (Post Graduate Diploma in Management) Institutes recognised by AICTE
Type V- Institutes directly under the control of various Central Ministries
Not only among states number of these Institutions varies largely, their responses are also much varied. Out of 11095 Stand Alone Institutions, 5713 have uploaded the data during 2010-11 survey. Type wise details are as under
Technical |
Teacher Training |
Nursing |
PGDM Institutes |
Institutes under Ministries |
|
Total |
3586 |
4923 |
2133 |
376 |
123 |
Form Uploaded |
1981 |
2796 |
873 |
54 |
9 |
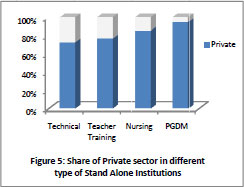
For the first time, Institutes under direct control of Central Ministries were identified and attempt was made to capture them in the survey. However, due to certain administrative problems most of them could not be approached. Stand Alone Institutions are mainly run by Private sector (75.7%); Private unaided - 65.4% & Private aided – 10.3%. Only 24.3% Institutions are in Government sector. 51.8% Institutions are located in Rural Area. |
 |
2.2 STUDENT ENROLMENT
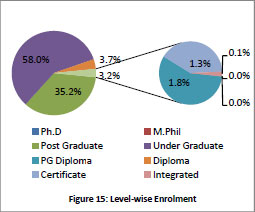
2.2.1 Level-wise Enrolment
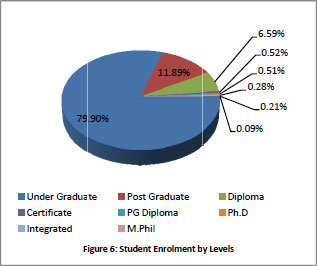 estimated enrolment in Regular Mode is given in Table 6 (a).
The highest numbers of students are seen enrolled at Under Graduate level across India. Out of the total 2,74,99,749 students, a vast majority of 2,19,72,260 students are enrolled in Under Graduate that is a sweeping 79.9%. On the other hand, second to Under Graduate, 11.9% students are enrolled in Post-Graduation. These are approximately 32.7 lakh students out of 2.75 crore students across India. The student enrolment from UG going higher to PG is thus decreasing steeply. There is a small share of 6.6% students enrolled at Diploma level in India that amounts to around 18.1 lakh students and out of this majority (16.2 lakh) students are enrolled in Technical, Teacher Training and Nursing. However, only 1.4 lakh students are enrolled at Certificate and PG Diploma levels each, these are approximately 0.5% of the total share each. Ph.D., M.Phil. and Integrated levels also have less than 0.5% student enrolment. In shares of States, Tamil Nadu tops in the enrolment of students in Universities (including constituent units) with 9,76,543 in 2010-11. This is followed by Delhi with 9,59,400 students enrolled and Maharashtra with 5,53,190 students. State-wise enrolment in responding University Teaching Departments alongwith its constituent Units and off campus centers is given in Table 7. State-wise enrolment in responding Colleges and Stand Alone institutions are given Table 8 and Table 9 respectively. As indicated in chapter 3, enrolment estimation has been done only for Under Graduate and Post Graduate level in Colleges and for which State-wise details is given in Table 10.
2.2.2 Programme-wise Enrolment (Based on Actual Response)
As regard to Programmes, out of total, 18 programmes were studied to see the student's concentration. B.A. has 57.11 lakh  students enrolled in it which is the highest enrolment. The percentage of male is 50.62% which shows almost equal distribution of male and female. BCA has total number of 3.75 lakh students and out of them 69.9% are males. B.Com. has 18.37 lakh students enrolled in total and out of them 58.28% are male students. B.E. has 8.69 lakh students enrolled out of which 70.68% students are from male category. 17.41 lakh students are enrolled in B.Sc. and out of them 54.22% are from male category and 45.78% are from female category. B.Tech. has 14.52 lakh enrolled students out of which 70.75% are males which keep the percentage of females restricted to less than 30%. LLB has total number of 1.18 lakh students out of which 69.72% are males representing unequal distribution of gender. M.A. has more than 9 lakh students enrolled with 52.97% of female students. MBA has total number of 5.62 lakh students having 73.02% of male students. MBBS has total number of 89,463 students and male representation is 60.82% in that. MCA has 2.27 lakh students out of which 66.24% are from male category. There is total number of 1.65 lakh students in M.Com., out of which 51.21% are females. M.Sc. has total number of 3.62 lakh students with 50.18% of males and 49.82% of females. M.Tech has total number of 88,064 students with high number of male students. The male representation is 75.19% and female percentage is only 24.81%. Programme-wise enrolment on the basis of actual response is given in Table 11.
2.2.3 Discipline/Subject-wise Enrolment (Based on Actual Response)
The total enrolment at Undergraduate Level in major discipline/subject based on actual response is given in Table 12. The highest number of students is enrolled in Arts/Humanities/Social Sciences courses. The total number of students enrolled in this are 63.02 lakh out of which 50.3% are males and 49.7% are females. Engineering and Technology is second major stream with 23.98 lakh students enrolled. The total number of male students enrolled in Engineering is 70.84%. Female participation in this sector is very low. This stream has 13 sub streams like Electronics Engineering, Computer Engineering, Mechanical Engineering, Electrical Engineering etc. The top 5 sub stream are Electronics Engineering with 5.42 lakh students, Computer Engineering with 4.75 Lakh students, Mechanical Engineering with 3.56 Lakh students, Electrical Engineering with 2.87 lakh students and Information Technology with 2.44 Lakh students enrolled. There are 18.31 lakh students enrolled in Commerce
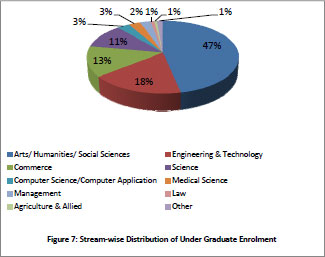 stream. The stream has 58.33% of male students and 41.67% of female students. The number of students enrolled in Science stream is 14.67 lakh and out of this 53.49% are male students and 46.51% are female students. In Computer Science/ Computer Application stream, there are 4.01 lakh students enrolled and 63.36% from them are males. Medical Science stream shows a different picture with higher number of female students. The total number of students is 3.76 lakh and female students are 2.01 lakh which makes it to 53.49%. Management stream has 3.38 lakh students with 67.51% of male students. The students enrolled in Law stream are 1.28 lakh out of which 68.42% are males. Home Science course has 89.25% of female students.
At Ph.D level, maximum number of students is enrolled in Science stream followed by Social Science. On the other hand at PG level maximum students enrolled in Social Science stream and Science comes at number two. As regard to gender distribution, it is seen that among major sectors, Agriculture and Engineering sector has lowest female participation. Enrolment in major discipline/subject at Ph.D, PG and M.Phill level based on actual response is given in Table 13.
The percentage of students opting for Ph.D. after their PG is also calculated to see the trend. In Agriculture and Allied courses 19.36% of the students are opting for Ph.D. after their Post-Graduation followed by Science courses where 7.5% of the students are opting for Ph.D. after their PG. It is closely followed by Engineering & Technology in which 7.32% of the students are opting for Ph.D. and in Medical science there are 3.28% of the students. Social Science has 2.47% of students opting for Ph.D. after the PG course in the same field.
The total number of Ph.D. students in Agriculture and Allied courses is 2680 out of which 76.40% are male students. The stream is divided into 6 sub-streams which are Agriculture, Veterinary & Animal, Horticulture, Fisheries Science, Forestry and Sericulture. Apart from Agriculture main stream with 1925 students (1410 males and 515 females), highest enrolment is seen in Veterinary & Animal sub-stream has 346 students followed by Horticulture with total number of 147 students. At PG level 13,841 students are enrolled in Agriculture & Allied sector. Agriculture sub-stream has total number of 10,080 students with 68.85% of male students and 31.15% of female students. Veterinary & Animal has total number of 2281 students with 77.9% of male students at PG level.
Commerce stream has 2533 students enrolled in it for Ph.D. with 60.28% of the male students. At PG level, 1.81 lakh students are enrolled with 50.11% of the female students. Computer Science/ Computer have total number of 1402 students with 55.99% of male students at Ph.D. level and at PG level there are total number 1.66 lakh students.
Engineering & Technology stream is divided into 13 sub-streams with total number of 15,346 students enrolled for Ph.D and 2.09 lakh students at PG level. Computer Engineering has highest number of 1806 students enrolled for Ph.D. with 72.25% of male students. Information Technology is the second highest having 1084 students with 82.84% of male students. At PG level also, Computer Engineering has highest number of 68,467 students with 60.19% of male students. Information technology has 20,012 students at PG level with 15,575 male students.
There is total number of 1924 students enrolled in Ph.D. in foreign languages. Foreign language stream is divided into 5 sub streams and English is at the top of the list with the students enrolled for Ph.D. There are 1637 students enrolled in Ph.D. in English with 50.88% of male students and 49.12% of female students. French language has total number of 120 students enrolled in Ph.D. 62.5% of the total students are from female category. At PG level, there is total number of 96,594 students enrolled. Out of this total number 94,531 students are enrolled in English language with 56.9% of female students.
Home Science stream is divided into 3 sub streams with total number of 725 students enrolled for Ph.D. There are total number of 8061 students enrolled at PG level with 461 males and 7600 females. Home Science has total number of 6140 students with 6052 females and 88 males. Food technology has 762 students with 560 females and 202 males. Nutrition has 1159 students at PG level with 988 females.
There is total number of 4755 students enrolled in Ph.D. in Indian languages which is divided into 11 sub-streams. The highest number of students is enrolled in Hindi language which is 1435 with 726 male students and 709 female students. Sanskrit has the second highest number of students. There are 1179 students enrolled in Sanskrit for Ph.D. with 765 males and 414 females. Altogether, at PG level, there are 1.98 lakh students enrolled out of which 1.16 lakh are females and 82,564 are males. Hindi with 39,737 students has the highest number of students enrolled at PG level. Out of that 43.45% are females and rest are males. Telugu has 22,239 students with 52.25% of female students. Bengali has 27,830 students enrolled at PG level with 63.19% of females. Tamil has total number of 25,540 students with 74.65% of females.
Medical Science has total number of 1781 Ph.D. students which is divided into 17 sub-streams. The highest number of students is enrolled in Pharmacy with 572 students having 432 males and 140 females. Ayurveda has total number of 105 students enrolled at Ph.D. level with 62 males and 43 females. Dentistry has 79 students, General medicine has 58 students and Nursing has 22 students enrolled at Ph.D. level. The number of total students at PG level is 54,335 with 57.31% of male students. Pharmacy has the highest number of students which is 14,867 with 61.9% of male students. All other sub-streams in Medical Science have less than 5000 students enrolled at PG level. Nursing has 5185 students, Dentistry has 4903 students and General Medicine has 4097 students at PG level.
Science stream has 22,7176 students enrolled for Ph.D. which is divided into 17 sub-streams such as Mathematics, Chemistry, Physics, and Zoology etc. Chemistry has the highest number of Ph.D. students which is 5249 with 3308 males and 1941 females. Physics has total number of 3007 students with 2118 males and 889 females. There is total number of 2356 students enrolled in Mathematics for Ph.D. out of which 1441 are males. Botany has 1516 students, Zoology has 1200 students, and Bio-technology has 1083 students enrolled for Ph.D. At PG level there are 3.03 lakh students enrolled in Science courses which are divided into 17 sub-streams. There are 67,317 students enrolled in Mathematics which is the highest among all the science streams. Out of the total, 51.72% are female students. Chemistry has enrolment of 60,342 students at PG level with 55.7% of male students. Physics has 28,848 students; Zoology has 19,767 students enrolled at PG level with 53.54% and 42.67% of males respectively. Zoology has higher number of female students.
Social Science stream has total number of 15,277 students enrolled for Ph.D. which is divided into 10 sub-streams. Out of this, Economics has the highest number of students enrolled in Ph.D. which is 2062 with 1128 males and 934 female students. History has total number of 1709 students with 1056 male students and 653 female students. Political Science has total number of 1179 students enrolled in Ph.D. with 765 males and 414 females. Apart from these Sociology has 1191 students, Geography has 941 students, Public Administration has 176 students, Psychology has 712 students, Philosophy has 640 students and Anthropology has 228 students enrolled for Ph.D. There are 6.17 lakh students enrolled in Social Science stream at PG level. The highest number of students is enrolled in History which is 92,335 with 52.5% of the male students. Political Science, Economics and Sociology have 61,285, 57,953, and 52,167 students respectively. The ratio of male students is high in all the courses except psychology representing total number of 13104 students with 63.65% of female students.
Taking a look at the Male-Female ratio at each level in Figure 8, the trend is of higher males than females in almost every level, except M.Phil., which is almost equal with 50% males and 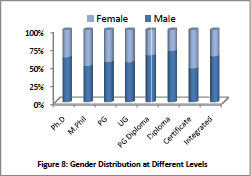 females each; while in Certificate courses, the female enrolment is slightly higher at 53.4% versus male enrolment of 46.6%. Student enrolment at both Under Graduate and Post Graduate levels has a similar trend with around 55% males and 45% females. PG Diploma has an unbalanced distribution with 65% males and 35% females. Similarly, Ph.D. and Integrated levels, both have an unequal distribution with around 62% males and 38% females. Diploma student enrolment projects the most lopsided picture with 71% male students and 29% female students.
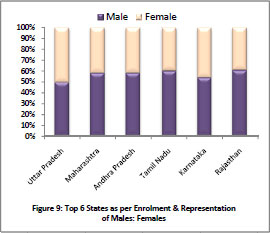 This majority trend of higher male enrolment than female enrolment of students is also seen across the levels in the state-wise distribution. The top 6 States are highlighted in Figure 9 in terms of highest total student enrolment are Uttar Pradesh, Maharashtra, Andhra Pradesh, Tamil Nadu, Karnataka, and Rajasthan. However in terms of total number of Institutions the ranking of these States is slightly different with Maharashtra (7196) at top followed by Andhra Pradesh (5425), Karnataka (5063), Uttar Pradesh (4723), Tamil Nadu (3504) and Rajasthan (3030). It is interesting to note that these 6 States with highest student enrolment constitute nearly 58% of the total student enrolment in Indian States. Rest of the 28 States (including UTs) fall within only 42% of the total student enrolment. So inevitably, the male students in these 6 States is almost 58% of the total students enrolled and female students enrolled in these 6 States contributes to be nearly 59% of the total female students across India.
Uttar Pradesh , with its highest student enrolment in India, has an almost equal ratio of 50% male and female students. Punjab has the highest male student enrolment – 65% males and 35% females. In Maharashtra, Andhra Pradesh and Tamil Nadu the male student enrolment is just below 60%. Karnataka has male student enrolment just above 50%. Another trend is seen in Kerala though with 57% female students and 43% male students enrolled. Meghalaya and Andaman & Nicobar Islands also have more female students i.e. nearly 54%, while male students are around 46% in both the States. Uttarakhand and Puducherry have an almost equal percentage of male and female students.
2.2.5 Social Category -wise Distribution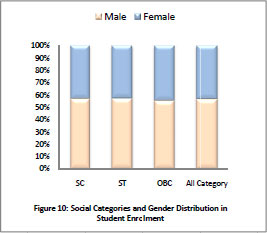
The total Estimated Student enrolment is 2,74,99,749, out of which nearly 56% are male students and rest 44% are female students enrolled. State-wise and Category-wise estimated enrolment is given in Table 14. SC student enrolment is 11.1% of the total and the male-female ratio is similar to the All Category. On the other hand, students belonging to ST category constitute only 4.4% of the total student enrolment with 57% male students. 27.6% of the total students belong to OBC with 55% of male students.
1 Two Technical Universities of UP did not respond and therefore enrolment in technical education is on lower side and also reflecting in gender distribution
2.2.6 Representation of Minority Students
Among Minority category, data on Muslims have been collected separately. According to the response received during the survey, 3.8% students belong to Muslim Minority and 1.8% from other Minority Community. Muslim Minority has more male students than females whereas other Minority has more females than males. Based on actual response, State-wise number of students from Minority and PWD category is shown in Table 15.
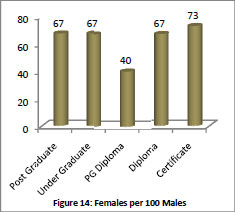
As per the response received during the survey 53975 PWD students are enrolled in higher education. Out of which, 26507 are Male and 27468 are Female students, thus having more female students. Category-wise distribution of PWD student is shown in adjacent table which indicate that as compared to all SC, ST and OBC students, share of PWD students of these categories is very low particularly in ST category. Female participation among PWD students in all categories is high except for ST category. It is highest in SC category with 159 females per 100 males followed by OBC (127). State-wise number of PWD students is given in Table 15.
| Box 6: Category-wise Distribution of PWD students | |||||
Category |
Male |
Female |
Total |
% out of Total |
Female per hundred male |
Total |
26507 |
27468 |
53975 |
|
104 |
SC |
1835 |
2919 |
4754 |
8.8 |
159 |
ST |
965 |
413 |
1378 |
2.6 |
43 |
OBC |
5796 |
7346 |
13142 |
24.3 |
127 |
2.2.8 Representation of Foreign Students
The total number of foreign national students enrolled in Indian Universities and Colleges are 27,531. Country-wise and level-wise foreign students in responding Institutions are given in Table 16. The foreign students come from 153 different countries from all across the globe. The top 10 countries of the foreign students are as in Figure 11. 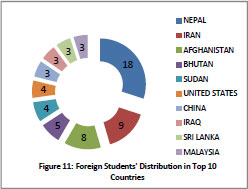 These 10 countries constitute 61% of the total foreign students enrolled. Rest of the 39% students comes from remaining 143 countries. Highest share of students come from the neighboring countries of which Nepal is 18% of the total, followed by Iran (9%), Afghanistan (8%), Bhutan (5%). Sudan and United States constitutes 4% each and China, Iraq and Sri Lanka constitutes 3% of the foreign students. Moreover, only 2 countries Malaysia (69%) and United States (51.4%) have more female students than male. Nepal, Iran and Sri Lanka have almost an equal share of male and female students. On the other hand, Afghanistan (90%), Sudan (95%) and Iraq (89%) have a considerably higher number of male students (Figure 11). Although maximum number of foreign students comes from Nepal, the maximum number enrolled in Ph.D is from Iran.
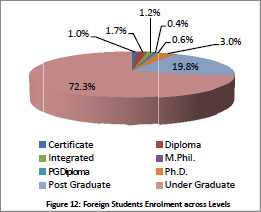
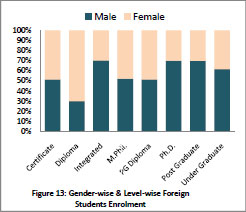
The highest numbers of students are enrolled in Undergraduate courses, that is, 72% of the total foreign students, followed by Post Graduate with about 20% enrolment. Enrolment in rest of the levels constitutes less than 3% (Figure 12). Foreign male students are higher in almost all the levels, except in Diploma where female students are higher (70%) than the male students (30%). At Certificate, M.Phil., and PG Diploma levels, the male-female students are almost 50% each. Integrated, Ph.D. and Post Graduate have 70% male and 30% female foreign students. Lastly, in Undergraduate, the male students are 61% as against 39% female students (Figure 13).
Looking at the State-wise distribution, it can be seen that Karnataka has the highest number of students coming from foreign countries which is 10,103. Apart from Karnataka, Andhra Pradesh (4698), Maharashtra (4329), Tamil Nadu (2383), Delhi (1529) and Uttar Pradesh (1016) reflects more than 1,000 foreign students. All the other States have less than 600 foreign students. State-wise and level-wise foreign students in responding Institutions are given in Table 17.
2.2.8 a Programme-wise Foreign Students
There are 14 programmes which are observing the highest enrolment of foreign students in India. Programme-wise number of foreign students in responding Institutions is given in Table 18. On the top we have B.A. with 2,458 students with 62% of male students. B.Com. is on 2nd top of the list with 2,359 students. The ratio of male-female student is 71:29. BCA has total number of 2334 students with 89.37% of male students. There are 1830 foreign students enrolled in B.Sc. out of which 64.2% are male students. BBA has total number of 856 students out of which 70% are from male category. There is total number of 190 students enrolled in LLB with 56.31% male students. At the Post Graduation level, 1510 students are enrolled at M.A. level with 63.7% male students. M.Sc. has reported enrolment of 1205 students with 72.6% of male students. There are 1143 students enrolled in B.E. out of which 81.8% are male students. MBBS has total number of 1140 students with the higher percentage of female students. The female percentage in MBBS is 54.56%. B. Tech. has total number of 1090 students with 923 male students. MBA has reported the enrolment of 920 foreign students with 66.73% of male students. MCA has total number of 109 students with 99 male students. At Ph.D. level, there are 850 students with male and female ratio of 69:31.
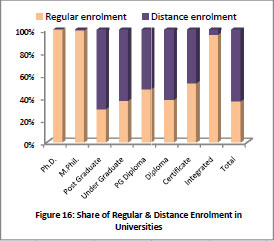
2.2.9 Enrolment in Distance Mode Distance education has become one powerful medium of obtaining degrees for huge number of students who are staying in far off and remote areas and for whom accessing universities on regular basis is still a dream. Distance enrolment constitutes 12.1% of the total enrolment in higher education, of which 40.1% are female students. Level wise distribution of students under distance mode is given in the adjacent table. At all Levels share of male student is higher than females. Looking at the State-wise variation, out of the total reported enrolled students pursuing studies through distance education, 6 States of India are providing education to around 67% of the students. These are Tamil Nadu with 18.3% of students, Delhi with 13.2%, Andhra Pradesh with 13%, Maharashtra with 10.4%, West Bengal with 6.5% and Bihar with 5.9% of the share of students enrolled through Distance mode. |
Box 7: Level-wise Distribution of Distance Enrolment
|
|||||||||||||||||||||||||||||||||||||||||||
 |
|
|||||||||||||||||||||||||||||||||
2.2.10 Enrolment in Stand-Alone Institutions
There is total number of 11,139 Stand Alone Institutions in India distributed with high variations among States. Type-wise distribution is shown in the Table 9. Out of 16,34,280 enrolled at several courses at stand-alone institutions 69% are males and 31% are females. Stand Alone Institutions are primarily meant for providing Diploma programmes.
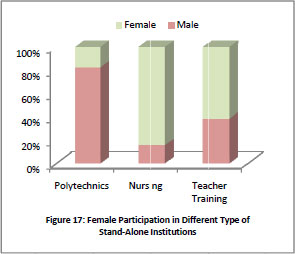 There is total number of 3586 Polytechnics in India and out of them 1981 reported the data during the survey. The highest number of Polytechnics is in Maharashtra which is 1160 and out of them only 541 responded. There is total number of 11.92 lakh students enrolled in Polytechnics and out of them 82.34% are male students and the remaining females with very less participation of around 17%. There are seven States which have total number of 9.96 lakh of students in Polytechnics which makes it to 83.59% of the total students enrolled in India in Polytechnics. These states are Tamil Nadu with 3.45 lakh students, Maharashtra with 2.14 lakh students, Karnataka with 1.44 lakh students, Punjab with 83,071 students, Odhisa with 72,680 students, Andhra Pradesh with 69,407 students and Haryana with 67,084 students. The number of male students is 3.13 lakh which is 90.71% of the total students enrolled in Polytechnic courses in Tamil Nadu which is highest from these top 7 States. The State at the second top is Maharashtra with the enrolment of 2.14 lakh students out of which 73.86% are male students. Karnataka has 76.98% of male students and 23.02% of female students from the total number of students enrolled which is 1.44 lakh. Punjab has recorded 83,071 students in Polytechnic courses with 86.45% of male students. Odhisa has 85.15% of male students, Andhra Pradesh has 73.61% of the male students and Haryana has 89.13% of the male students.
The total number of Nursing Institutions is 2133 and out of them only 873 responded with the data which is only 40% response rate. The total enrolment in nursing course is 1.04 lakh and out of them 84.64% are female students and 15.36% are male students.
Top 3 States are Karnataka, Andhra Pradesh and Kerala are contributing 79.56% of the students out of the total students enrolled in India for nursing. Karnataka has the highest number of students enrolled in nursing course with 41,732 students, followed by Andhra Pradesh with 23,179 students and Kerala with 18,288 students. Karnataka has the highest number of students enrolled in nursing course with 73.33% of female students; Andhra Pradesh has 95.06% of the female students. Kerala has 96% of the female students enrolled in nursing course which are highest in these top 3 States.
The total number of Teacher Training institutions are 4924 and out of them only 2796 responded with the data which makes the response rate above 50%. The total number of students enrolled in teacher training course is 3.22 lakh at all India level. Out of them 38.15% are males and 61.85% are females. The top 5 States covering around 80% of the total students enrolled for teacher training course are Maharashtra with 1.05 lakh students followed by Karnataka with 58,133 students, Uttar Pradesh with 33,402 students, Gujarat with 31,421 students and Tamil Nadu with 27,935 students. The number of female students is high in all the States except Uttar Pradesh. Scenario of these top 5 States is as follows:
Maharashtra has 59.45% of female students, Karnataka has 68.84% of female students; Uttar Pradesh has only 47.49% of female students and the higher number of male students which is around 52.5%. Gujarat has 62.83% of female students and Tamil Nadu has the highest number of female students. The percentage of female students is 81.73% which is highest in these top 5 States.
There are more than 70% colleges running in Private sector; aided and unaided taking together, but it caters only 61% of the total enrolment. It shows lower per college enrolment in private sector. State-wise enrolment in Private and Government Colleges as per response is given in Table 5(a).
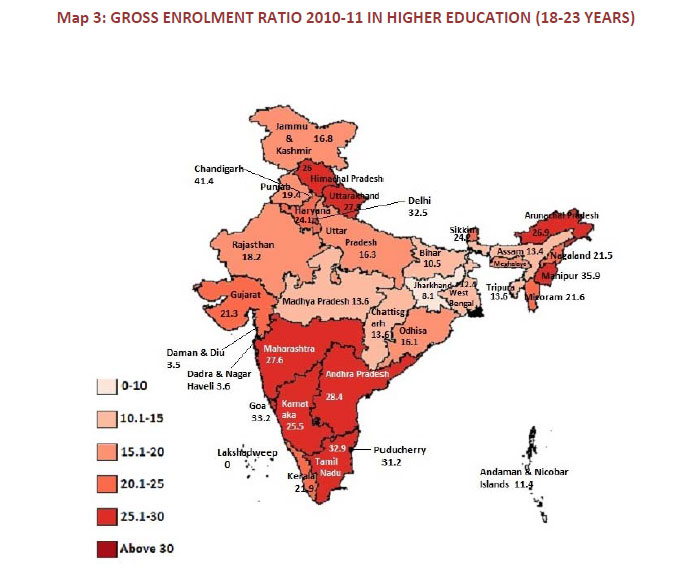
3.GROSS ENROLMENT RATIO IN HIGHER EDUCATION (18-23 Years)
Gross Enrolment Ratio (GER) in Higher education in India is 19.4, which is calculated for 18-23 years of age group. For Scheduled Castes it is 13.5 and for Scheduled Tribes it is 11.2% as compared to the national GER of 19.4.
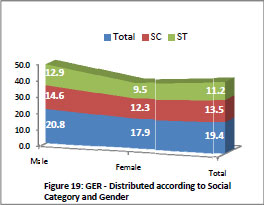
GER for male population at all India level is 20.8 of the total population between the age group of 18-23 years whereas for SC Males it is 14.6 and 12.9 for ST males. At national level, GER of SC female is 12.3 and 9.5 for ST females in comparison to 17.9 of national level.
The GER for females in all categories is highest in Chandigarh with 41.4%. Goa, Manipur and Tamil Nadu also have GER of more than 30 for their female population. There are some States whose population is very low as per census but actual number of students are comparatively higher and therefore GER is coming to very high. For such States GER has been shown as 100. These States have been ignored while analysing the GER. State-wise GER and GPI are shown in Table 19 and Table 20 respectively.
4.TEACHING STAFF
The total number of teachers in responding Institutions is 7,65,349. Out of which more than half about 62.8% are male teachers and 37.85% are female teachers. The lowest gender proportion is recorded in Bihar where female teachers are more than 5 times lesser than the male staff – 84.4% male and only 15.6% female teachers are reported; Arunachal Pradesh comes close second with 82.9% male teachers and 17.1% female teachers, that is, more than 4 times lesser than the male staff. Odisha, West Bengal, Jharkhand and Uttar Pradesh have only 30% (approximately) female staff of the total teachers available in States. A few States Delhi, Chandigarh, Goa, Kerala and Meghalaya on the other hand have more female teachers than male teachers.
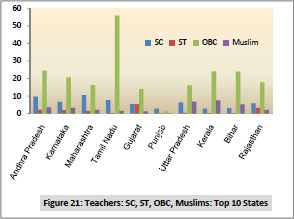
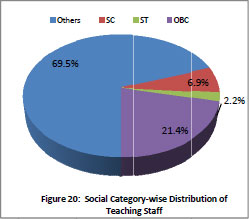
In terms of caste and religious minorities’ representation in teachers in varsities in India, the distribution is considerably leaning towards one category. At All-India level, teachers belonging to General category are more than half, that is 69.5% of the total number of teachers in India; OBC follows with 21.4%; while SC and ST with 6.9% and 2.2% respectively (Figure 20). Merely 2.9% teachers come from Muslim minority group, and 3.2% are other minorities. State-wise number of Teachers in various Socio-religious categories is given in Table 21 (a) and 21(b).
 Out of the top 10 States, the leading 3 are Andhra Pradesh with 9.7% SCs and 2.1% STs, Karnataka with 6.7% SCs and 1.9% STs and Maharashtra with the highest 10.5% SCs and 1.6% STs. It is also to be noted that within these categories, the number of female teachers is significantly lower than the male teachers.
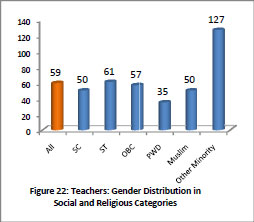
As mentioned above, another significant representation in terms of gender distribution is the number of female teachers per 100 male teachers. At the all-India level there are merely 59 female teachers per 100 male teachers. Similarly, in SC category the female staff is only half that is 50 per 100 males; ST is same as total across India with 61 females per 100 males and OBC has a little more than half i.e. 57 female teachers. The Muslim minorities are only 50 female teachers per 100 male, but other minorities are inversely higher with 127 females per 100 male teachers. However, it is to be noted that female representation in teachers belonging to Persons with Disabilities (PWD) category is very low, that is, only 35 females per 100 male teachers.
 |
 |
 |
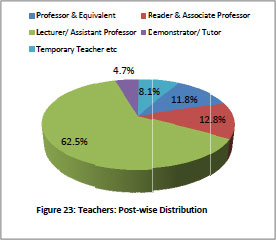
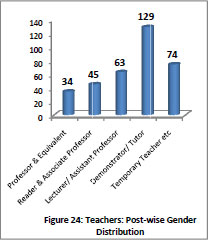
Among various levels of posts, majority of teachers are of the level of Assistant Professor, followed by Associate Professor. The distribution is shown in Figure 23 and the number of female teachers per 100 male teachers at various levels is shown in Figure 24. The state-wise number of teacher at various levels with male and female wise break-up in responding institutions are given in Table 22. The higher the post, lower representation of female is clearly seen from the Figure.
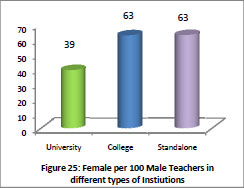
The number of total teachers at University level is around 1 lakh out of which 72% are males and 28% are females. At college level, the number of teachers is 5.33 lakh with 61.28% of male teachers. In Standalone institutes, total number of teachers is 1.10 lakh with 61.35% male teachers. Looking at female per 100 male teachers, there are 39 teachers at University level, 63 female teachers per 100 male teachers at college and Stand Alone Institutions each.
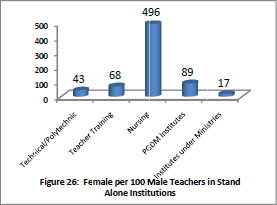
In different types of Stand Alone Institutions, the number of female teachers per 100 male teachers is varying significantly as there are only 43 female teachers per 100 male teachers in Technical/ Polytechnic Institutions, 68 in Teacher Training, 89 in PGDM Institutions and 17 in Institutions under Ministries which is the lowest. Contrast to this, nursing courses has 496 female teachers per 100 male teachers which is the highest among all the types.
5. NON-TEACHING STAFF
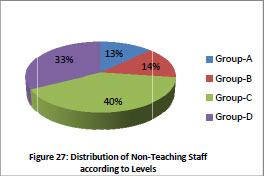 The non-teaching posts are 6,16,020 in all and are divided into four groups – A, B, C and D. The share of Group-C is the highest with 40%, while Group-D seconds it with 33%. Group-A and Group-B comprise of 13 and 14 per cent non-teaching posts respectively (Figure 27).
Looking at the male and female distribution in these non-teaching posts as in Figure 28, here we have a picture similar to that of teaching staff and student enrolment in India as the total male non-teaching staff is more than female staff, which is 75% as opposed to merely 25% female staff. 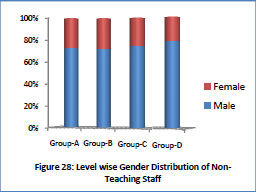
In group-wise posts, the non-teaching staffs have more male members in each group as shown in Figure 28. There are 72% males and 28% females in Group-A. Though the numbers are different in Group-B, the percentage distribution is the same. In Group-C the male share is 75% as against 25% females, while in Group-D there are highest male staff members with 78% but only 22% females.
 In U.P. the male staff share is the highest with 90% and only 10% females, while Gujarat is close second with 80% male staff and 20% female staff. Maharashtra is closely behind with 79% male staff and 21% female staff. Tamil Nadu also has a higher share of male staff with 70% and 30% females. Karnataka comes sixth in this ratio share with 65% male and 35% female staff posts. This same picture is reflected in the group-wise break up of data. Inversely, in Puducherry in Group-A female non-teaching staff is 53% slightly higher than male staff 47%. In Arunachal Pradesh in Group-A the ratio male: female is 18:1, while in Sikkim there are no females and only 6 male non-teaching staff posts. In Group-B and C Goa has a few numbers of female non-teaching staff higher than the male staff while Group-D has only male staff higher than female staff in all the States and Union Territories of India. State-wise number of non teaching staff in different groups in responding Institutions is given in Table 23.
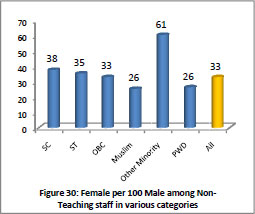
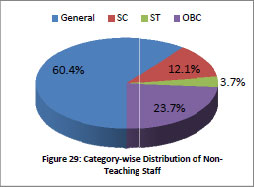
In regard to Social category, 60.4% non teaching staffs are from General category, 23.7% are from OBC, 12.1% from Scheduled Caste and 3.7% are from Scheduled Tribe. State-wise number of non teaching staff in different categories in responding Institutions is given in Table 24.
The average number of females per 100 male non-teaching staff is 33. The highest number of females is 61 from Other Minority Group and Muslims have the lowest number of females per 100 male non-teaching staff with 26 females. SC has 38, ST has 35, OBC has 33 females, and PWD has 26 females per 100 male non-teaching staff.
Among non-teaching staff, data was collected separately for the Library staff and Physical Education Staff. There are 51 females in library staff and 15 females in Physical Education staff per 100 male staff.
CHAPTER 3 – ESTIMATION METHODOLOGY
Three Categories of Higher Educational Institutions, namely University, College, Stand-Alone Institution were identified and surveyed. Since there is large variation in terms of structure, programme, student enrolment etc. among universities and data from approximately 90% of these have been collected, no estimation has been done in case of University. List of Stand-Alone Institutions as already indicated was not firm and States have revised it frequently. Keeping this in view no estimation has been done for such Institutions also. Only Colleges enrolment has been estimated at All India Level and State level, by adopting sampling technique assuring the sufficiency of sample in different stratum, Levels of Programme being the Strata. Methodology for estimation of enrolment has been described in subsequent sections.
The most important and phenomenal task for the survey was to compile the list of Colleges. There are numerous players in this field, which were not easily identifiable. An exhaustive list of colleges in the country was not available and therefore university was identified as best source to prepare the list of colleges. Thus, College list was dynamically generated through University during the survey. Software was designed in such a manner that as soon as the university uploads its form on the server, college list was automatically populated in the data-base during 2010-11 survey. All the affiliating University except the 7 have uploaded the data and therefore almost complete list of colleges are available.
In addition to the Affiliated and Constituent colleges, for Off-Campus Centres/ PG Centres and for Recognised Centres of Universities, DCF-II (the format in which the data was required to be submitted) was available to be filled-in. All the Constituent Colleges, the Affiliated Colleges and the Off-Campus Centres were required to fill DCF-II. Constituent units of University, primarily of Private and Deemed Universities, which are integral part of University, have also been listed by these Universities as
College means any Institution, whether known as such or by any other name which provides for a course of study for obtaining any qualification from a university and which, in accordance with the rules and regulations of such university, is recognised as competent to provide for such course of study and present students undergoing such course of study for the examination for the award of such qualification. These are the institutions established or maintained by or admitted to the privileges of the University.
Colleges are generally of two types:
- University/Constituent College maintained by the University
- Affiliated College
Constituent College. However, DCF-II for such units were not required to be filled. For Recognised Centres, in normal cases, DCF-II have not been filled, but in a few cases where these are independent institutions, DCF-II have been filled. Thus, there are four types of College/Institution, for which DCF-II have been filled:
In bracket, numbers of such institutions during AISHE 2010-11 are given. State-wise number of colleges of different types is given in Table 25.
Although intended to cover the entire population, approximately 50% colleges' data could be collected and thus to have an idea of total College's enrolment, estimation adopting proper sampling methodology, was required. Constituent Colleges are mainly located in Bihar, Jharkhand and Maharashtra and most of them have uploaded the data. Therefore, enrolment for Constituent Colleges including constituent units of University has not been estimated except in the State of Jharkhand. In view of poor response in Jharkhand, enrolment for Constituent Colleges was also estimated. For PG/Off-Campus Centres and for Recognised Centres also no estimation has been made. During 2010-11 survey, DCF-II for only 76 PG/Off-campus centres and 287 Recognised centres have been filled. State-wise number of responded colleges of different types is given in Table 26.
Thus for only affiliated colleges, enrolment has been estimated based on the Stratified Sampling technique. Post-Stratification has been done, after the survey for the year 2010-11 is closed.
It shows the extent of variability in relation to mean of the population. Thus any value less than 0.05 indicates high homogeneity in the sample and high reliability of estimates based on the sample. |
A Off-Campus Centre/ PG Centre is a centre of the University established by it, outside the main campus (within or outside the state) operated and maintained as its constituent unit, having the University's compliment of facilities, faculty and staff. A Recognised Centre is an institution attached with the University for the purpose of awarding degree in respect of programmes being run in these institutions. e.g. Army Cadet College Wing, Indian Military Academy, Dehradun is not affiliated with any University but the degree in respect of Programmes run in the institute are awarded by Jawaharlal Nehru University.
|