All India Survey on Higher Education (AISHE) was initiated in 2011 during which data for the year 2010-11 was collected. The survey was utmost necessary as none of the source of data on Higher education was giving complete picture of higher education in the country. Also, there were many important parameters on which data is required for policy making but either no data was available or incomplete data was available. For the first time all the major Stakeholders in Higher Education such as University Grants Commissions, All India Council for Technical Education, Medical Council of India as well as State Governments participated in the data collection exercise. The entire survey was conducted through electronic mode and a dedicated portal http://aishe.gov.in was developed for the purpose, thus making the exercise completely paperless. The survey covered all the Institutions in the country engaged in imparting the higher education. Data is being collected on several parameters such as teachers, student enrolment, programmes, examination results, education finance, infrastructure etc. Indicators of educational development such as Institution Density, Gross Enrolment Ratio, Pupil Teacher Ratio, Gender Parity Index etc. are calculated from the data collected through AISHE. These are useful in making informed policy decisions and research for development of education sector.
1.1 Steering Committee & Working Group: The XII Plan categorically highlighted the need for a strong current and comprehensive data for evidence-based policy making and effective planning. The Plan document also took note of the All India Survey on Higher Education initiated by the Ministry of Human Resource Development and indicated that it can provide useful insights and can be the first step towards creating a comprehensive higher education data management system. Keeping this in view, a new plan scheme Higher Education Statistics & Public Information System (HESPIS) has been approved in XII Five Year Plan. With a view to ensure coordinated approach to all these efforts, particularly data collection efforts and benefit from synergy in such efforts, a Steering Committee for Higher Education Statistics & Public Information System has also been constituted under the chairmanship of Secretary (Higher Education), MHRD and different stake-holders as members. The notification on constitution of the Steering Committee and its Terms of Reference is given at Annexure-1.
A working Group has also been constituted under the chairmanship of Joint Secretary (Higher Education), MHRD to provide Technical Guidance for the proper conduct of the survey. The Working Group functions under the ambit of Steering Committee. The notification on constitution of the Working Group and its Terms of Reference is given at Annexure-2.
1.2 Identification of Institutions for Coverage–The Institutions have been classified in following 3 broad categories
- University & University Level Institutions i.e. the Institutions which are empowered to award degree under some Act of Parliament or State Legislature.
- Colleges/Institutions which are not empowered to provide degree in its own name and therefore are affiliated/recognised with Universities.
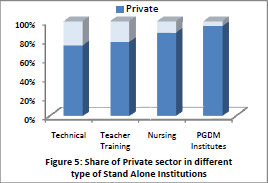
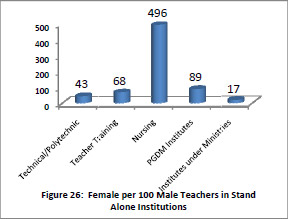
- Stand-alone institutions (not affiliated with Universities) which are not empowered to provide degree and therefore run Diploma Level Programmes. During the survey, 5 types of such Institutions have been covered. These are, (i) Technical such as Polytechnics & (ii) Post Graduate Diploma in Management recognised by AICTE (iii) Teacher Training such as District Institute of Education & Training recognized by National Council for Teacher Education (iv) Nursing Institutes recognized by Indian Nursing Council and (v) Institutes directly under the control of various Central Ministries.
1.3 Reference Period for AISHE 2011-12: Reference date for filling up the Data Capture Formats is 30th September, 2011. The number of institutions, teachers and students has been recorded on the basis of their actual number as on 30th September, 2011.
Information in respect of Examination Result has been collected for the students passed out/awarded degree on or before 30th December 2011 for the academic year 2010-11.
Financial Information has been recorded for the financial year i.e. 1st April 2011 to 31st March 2012.
1.4 Formulation of Concepts & Definition and Instruction Manual: All the terms generally used in higher education such as University, college, programme, discipline, faculty, department have been clearly defined in the instruction manual, which also includes item-wise instructions to fill the forms. Concepts and Definitions used in the survey are given at Annexure-3.
1.5 List of Higher Education Institutions: During 2010-11 the lists of all the Universities and Stand-alone Institutions have been prepared by adopting the following method:
- Consulting the websites of the State Government Departments, Ministries and Institutions.
- Consulting all the Central Ministries, Councils and State Governments for providing the list of Institutions under their control.
Different colleges are regulated with different regulatory bodies. There are some colleges whose programmes are recognised by more than one regulatory body. To avoid duplication or omission, University was identified as best source to prepare the list of colleges. Thus, College list was dynamically generated through University during the AISHE 2010-11.
From 2011-12, following mechanism was adopted to update the list
. List of Universities through State Governments, Central Ministries, UGC and self disclosure by the Universities, which is to be verified by the Act of the University.
. List of Colleges through Universities
. List of Stand Alone Institutions through respective Councils, State Governments and Central Ministries
An online module has been developed for this purpose. Apart from addition and deletion, module has been developed to affiliate and de-affiliate colleges which maintain the identity of the college even after shifting from one University to other. A provision has also been made for those colleges which are upgraded to University so that there is always a backward linkage.
1.6 Partner Agencies – Statistics Division of MHRD was involved in providing technical support, which includes preparation of DCF, providing training in workshops, assisting National Informatics Centre (NIC) in software development etc. The software support was provided by NIC. Several regulatory authorities also took part by instructing their institutions for providing information in the survey.
Nodal officer has also been appointed in each State to coordinate the survey work. Most of the States have nominated Higher/ Technical Education department as Nodal department/ agency for coordinating the Survey. However, Chandigarh, Jharkhand, Kerala, Odisha, and Puducherry have engaged agencies/ Department other than Higher/ Technical Education Department. Along with State nodal officers, 3 more nodal officers, one each from Directorate of Technical Education (for Polytechnics), SCERT (for DIETs and Teacher Training diploma level institutions) and State Nursing Council have also been appointed to co-ordinate with Standalone Institutions. The names of these State Nodal officers and University Nodal Officers (Affiliating) are shown at Annexure-4 and Annexure-5
1.7 Mode of Survey - A dedicated portal (http://aishe.gov.in) has been developed with the help of National Informatics Centre (NIC) for collection & compilation of the data. All the Institutions need to register on the portal for accessing the portal and uploading its data. The registrations of the Institutions are approved by appropriate level of officers at State/ Central Level and in case of colleges, by University nodal Officers. The e-version of DCF has been prepared in such a manner that it expands according to the structure/size (Number of Faculties/ Departments, Programmes, etc.) of the Institution. The Data Capture Format is downloaded from the portal, filled off-line and then filled-in DCF is uploaded, which has made it completely paper-less. DCF has been designed in such a manner that no manual aggregation is required at any level. No investigator is sent to the Institution to collect the data. In fact the nodal officers appointed by the Institutions themselves are the Investigator and they are responsible for filling up the DCF and uploading it on the portal. This eliminates the duplication of effort in data entry once form is uploaded by the Institution. Once data is uploaded by the Institutions, data compilation is done automatically in pre-designed formats. One unique feature is that the filled in DCFs are always available on the portal, which can be seen by the Institutions and higher level authorities and can be modified, whenever required, till survey is closed.
1.8 Duration of the Survey – AISHE 2011-12 started in the month of April, 2013 and continued till June, 2014. In between Survey for the year 2012-13 was also launched on3rd September, 2013, with one of the special features that data, such as basic details, name of faculties/departments and list of programmes can be pre-filled in future survey DCF from the previous filled in DCF with an option to edit pre-filled data.
1.9 Institutions Uploaded Data under Survey – In AISHE 2011-12, 611 Universities, 16021 Colleges and 4654 Stand Alone Institutions; have uploaded the form on the portal. However, in addition to the actual response received during AISHE 2011-12, data has been pooled from the AISHE 2010-11 for the Institutions whose name existed in 2011-12 but has not submitted data so far. So the results are actually based on a larger sample than the actual response of 2011-12 survey which can be seen from the following Table.
University |
Colleges |
Stand Alone |
|
Total |
642 |
34852 |
11126 |
Response in AISHE 2011-12 |
611 |
20765 |
5542 |
Total number of Institutions after pooling data from AISHE 2010-11 |
621 |
23203 |
6676 |
List of Universities, which did not upload the data during 2011-12 is also shown at Annexure-6.
CHAPTER 2 – ANALYSIS
2.1 NUMBER OF INSTITUTIONS
2.1.1 University
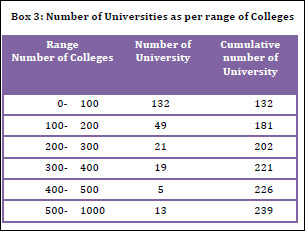
During 2011-12, 642 Universities were listed and they were requested to upload the data. The state-wise number of universities with types is shown in Table-1. The type-wise details of the 642 Universities are given below. Out of them, 611 Universities uploaded the data during AISHE 2011-12 and there were 10 Universities, which had uploaded the data during 2010-11, but did not upload the data during 2011-12. The names of remaining Universities, which could not upload the data, are listed in Annexure-6.
|
Box 3: Number of Universities as per range of Colleges
|
||||||||||||||||||||||||||||||||||||||||||||||||||||||||
|
||||||||||||||||||||||||||||||||||||||||||||||||||||||||
|
||||||||||||||||||||||||||||||||||||||||||||||||||||||||
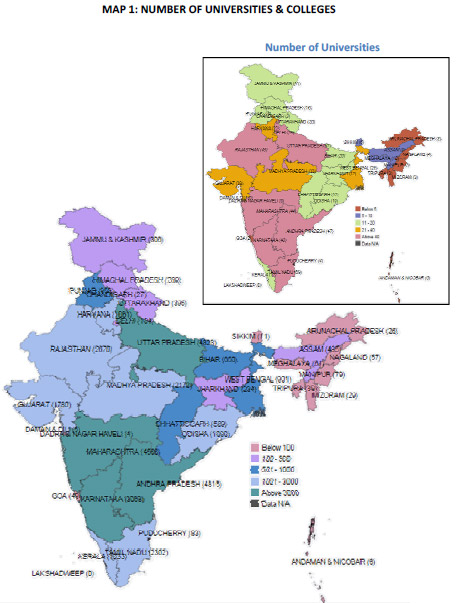
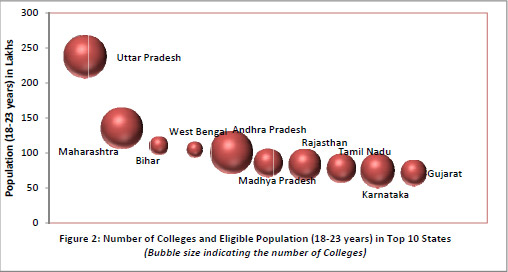
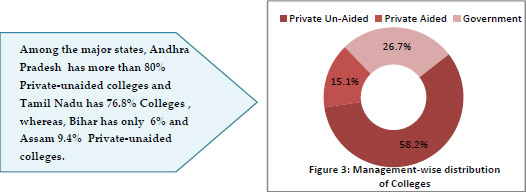
College density, i.e. the number of colleges per lakh eligible population (population in the age-group 18-23 years) varies from 6 in Bihar to 64 in Puducherry as compared to All India Average of 25. The top 6 states in terms of highest number of Colleges in India are Uttar Pradesh, Andhra Pradesh, Maharashtra, Karnataka, Rajasthan & Tamil Nadu and out of them all States have more than 25 Colleges per lakh population except Uttar Pradesh. In Uttar Pradesh, there are 4828 Colleges and for every one lakh population there are 20 Colleges. Similarly Andhra Pradesh comes close second with 4815 Colleges and 48 Colleges per lakh population, which is highest in all these 6 States. Maharashtra comes at third position with 4566 Colleges & 34 Colleges per lakh population whereas Karnataka is at fourth position with 3068 Colleges and 41 Colleges per lakh population. Rajasthan comes at fifth position with 2670 Colleges and having College density 32. Tamil Nadu lastly has 2302 Colleges and 30 Colleges for every one lakh population. State-wise number of colleges and the density are shown in Table 4.
Most of the Colleges run only Under Graduate level programmes. Only 2.2% and 35% Colleges run Ph.D. and Post Graduate Level programmes respectively. |
||||||||||||||||||||||||||||||||||||||||||||||||||||||||
|
||||||||||||||||||||||||||||||||||||||||||||||||||||||||
|
||||||||||||||||||||||||||||||||||||||||||||||||||||||||
2.1.3 Stand Alone Institution
|
||||||||||||||||||||||||||||||||||||||||||||||||||||||||
|
||||||||||||||||||||||||||||||||||||||||||||||||||||||||
Stand Alone Institutions are mainly run by Private sector (78.7%); Private unaided - 68.3% & Private aided – 10.4%. Only 21.3% Institutions are in Government sector. 54% Institutions are located in Rural Area. |
||||||||||||||||||||||||||||||||||||||||||||||||||||||||
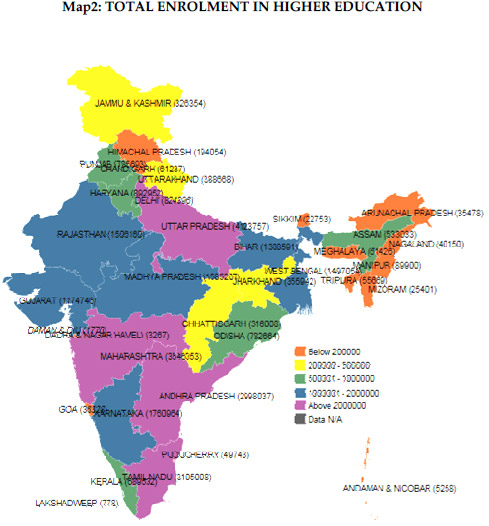
2.2 STUDENT ENROLMENT |
||||||||||||||||||||||||||||||||||||||||||||||||||||||||
 |
||||||||||||||||||||||||||||||||||||||||||||||||||||||||
2.2.2 Programme-wise Enrolment (Based on Actual Response)  which shows almost equal distribution of male and female. B.Com. has 24.65 lakh students enrolled in total and out of them 55.9% are male students. B.Tech. has 16.06 lakh enrolled students out of which 70.4% are males which keep the percentage of females restricted to less than 30%. B.E. has 13.75 lakh students enrolled out of which 70.5% students are from male category. 23.19 lakh students are enrolled in B.Sc. and out of them 51% are from male category and 49% are from female category. BCA has total number of 4.16 lakh students and out of them 66.2% are males. LLB has total number of 1.44 lakh students out of which 68.7% are males representing unequal distribution of gender. M.A. has more than 10 lakh students enrolled with 55.2% of female students. MBA has total number of 4.89 lakh students having 66.3% of male students. MBBS has total number of 1 lakh students and male representation is 51% in that. MCA has 2.06 lakh students out of which 59.9% are from male category. There is total number of 2.12 lakh students in M.Com., out of which 52.6% are females. M.Sc. has total number of 4.44 lakh students with 47.1% of males and 52.9% of females. M.Tech has total number of 1.02 lakhs students with higher number of male students. The male representation is 66.5% and female percentage is only 33.5%. Programme-wise enrolment on the basis of actual response is given in Table 11. which shows almost equal distribution of male and female. B.Com. has 24.65 lakh students enrolled in total and out of them 55.9% are male students. B.Tech. has 16.06 lakh enrolled students out of which 70.4% are males which keep the percentage of females restricted to less than 30%. B.E. has 13.75 lakh students enrolled out of which 70.5% students are from male category. 23.19 lakh students are enrolled in B.Sc. and out of them 51% are from male category and 49% are from female category. BCA has total number of 4.16 lakh students and out of them 66.2% are males. LLB has total number of 1.44 lakh students out of which 68.7% are males representing unequal distribution of gender. M.A. has more than 10 lakh students enrolled with 55.2% of female students. MBA has total number of 4.89 lakh students having 66.3% of male students. MBBS has total number of 1 lakh students and male representation is 51% in that. MCA has 2.06 lakh students out of which 59.9% are from male category. There is total number of 2.12 lakh students in M.Com., out of which 52.6% are females. M.Sc. has total number of 4.44 lakh students with 47.1% of males and 52.9% of females. M.Tech has total number of 1.02 lakhs students with higher number of male students. The male representation is 66.5% and female percentage is only 33.5%. Programme-wise enrolment on the basis of actual response is given in Table 11.
2.2.3 Discipline/Subject-wise Enrolment (Based on Actual Response) 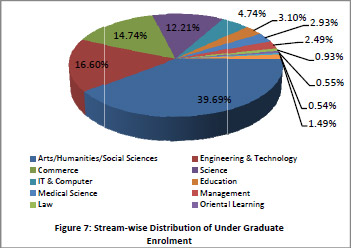 The total enrolment at Undergraduate Level in major discipline/subject based on actual response is given in Table 12. The highest number of students is enrolled in Arts/ Humanities/ Social Sciences courses. The total number of students enrolled in this are 66.36 lakh out of which 48.9% are males and 51.1% are females. Engineering and Technology is second major stream with 27.75 lakh students enrolled. The total number of male students enrolled in Engineering is 71.5%. Female participation in this sector is very low. This stream has 13 sub streams like Electronics Engineering, Computer Engineering, Mechanical Engineering, Electrical Engineering etc. The top 5 sub stream are Electronics Engineering with 6.93 lakh students, Computer Engineering with 5.85 Lakh students, Mechanical Engineering with 5.07 Lakh students, Electrical Engineering with 3.63 lakh students and Civil Engineering with 2.64 Lakh students enrolled. There are 24.65 lakh students enrolled in Commerce stream. The stream has 55.89% of male students and 44.11% of female students. The number of students enrolled in Science stream is 20.42 lakh and out of this 51.23% are male students and 48.77% are female students. In Computer Science/ Computer Application stream, there are 7.93 lakh students enrolled and 59.78% from them are males. Medical Science stream shows a different picture with higher number of female students. The total number of students is 4.89 lakh and female students are 2.98 lakh which makes it to 60.84%. Management stream has 4.16 lakh students with 64.41% of male students. The students enrolled in Law stream are 1.56 lakh out of which 68.04 % are males. Home Science course has 90.98% of female students. The total enrolment at Undergraduate Level in major discipline/subject based on actual response is given in Table 12. The highest number of students is enrolled in Arts/ Humanities/ Social Sciences courses. The total number of students enrolled in this are 66.36 lakh out of which 48.9% are males and 51.1% are females. Engineering and Technology is second major stream with 27.75 lakh students enrolled. The total number of male students enrolled in Engineering is 71.5%. Female participation in this sector is very low. This stream has 13 sub streams like Electronics Engineering, Computer Engineering, Mechanical Engineering, Electrical Engineering etc. The top 5 sub stream are Electronics Engineering with 6.93 lakh students, Computer Engineering with 5.85 Lakh students, Mechanical Engineering with 5.07 Lakh students, Electrical Engineering with 3.63 lakh students and Civil Engineering with 2.64 Lakh students enrolled. There are 24.65 lakh students enrolled in Commerce stream. The stream has 55.89% of male students and 44.11% of female students. The number of students enrolled in Science stream is 20.42 lakh and out of this 51.23% are male students and 48.77% are female students. In Computer Science/ Computer Application stream, there are 7.93 lakh students enrolled and 59.78% from them are males. Medical Science stream shows a different picture with higher number of female students. The total number of students is 4.89 lakh and female students are 2.98 lakh which makes it to 60.84%. Management stream has 4.16 lakh students with 64.41% of male students. The students enrolled in Law stream are 1.56 lakh out of which 68.04 % are males. Home Science course has 90.98% of female students.
Commerce stream has 3257 students enrolled in it for Ph.D. with 58% of the male students. At PG level, 2.12 lakh students are enrolled with 52.62% of the female students. IT & Computer have total number of 1033 students with 49.66% of male students at Ph.D. level and at PG level there are total number 2.58 lakh students.
|
||||||||||||||||||||||||||||||||||||||||||||||||||||||||
2.2.4 Gender Distribution
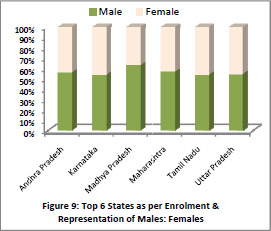
Uttar Pradesh, with its highest student enrolment in India, has 54% male and 46% female students. Among major States, Madhya Pradesh has the highest male student enrolment – 63% males and 37% females followed by Bihar with 60% Male Students. In Maharashtra, Karnataka, Andhra Pradesh and Tamil Nadu the male student enrolment is hovering around 55%. Another trend is seen in Kerala though with 59% female students and 41% male students enrolled. Andaman & Nicobar Islands, Chandigarh and Meghalaya also have more female students i.e. nearly 54%, while male students are around 46% in both the States. Assam, Jammu & Kashmir, Uttarakhand and Puducherry have an almost equal percentage of male and female students. |
||||||||||||||||||||||||||||||||||||||||||||||||||||||||
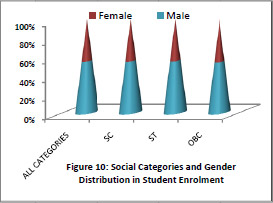
2.2.5 Social Category -wise Distribution
2.2.6 Representation of Minority Students
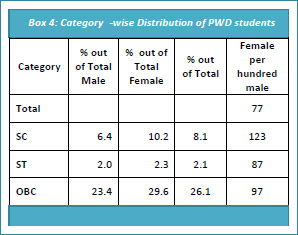
2.2.7 Representation of PWD students 65552 PWD students are enrolled in higher education. Out of which, 37153 are Male and 28399 are Female students. Category-wise distribution of PWD student is shown in adjacent table which indicate that as compared to all SC, ST and OBC students, share of PWD students of these categories is very low particularly in ST category. Female participation among PWD students is highest in SC category with 123 females per 100 males followed by OBC (97). State-wise number of PWD students is given in Table 15.
|
||||||||||||||||||||||||||||||||||||||||||||||||||||||||
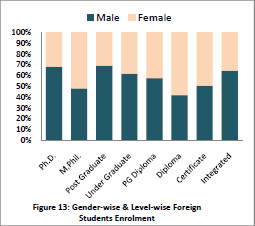
2.2.8 Representation of Foreign Students
Looking at the State-wise distribution, it can be seen that Karnataka has the highest number of students coming from foreign countries which is 12,058. Apart from Karnataka, Tamil Nadu (4866), Maharashtra (4242), Andhra Pradesh (3580), Delhi (1878), Uttar Pradesh (1725) and Punjab (1055) reflects more than 1,000 foreign students. State-wise and level-wise foreign students in responding Institutions are given in Table 17.
|
||||||||||||||||||||||||||||||||||||||||||||||||||||||||
| 2.2.8 a Programme-wise Foreign Students
There are 15 programmes which are observing more than 1000 foreign students and accounts for more than 80% of the Students. Programme-wise number of foreign students in responding Institutions is given in Table 18. On the top we have B.Tech. with 2,874 students with 84.5% of male students. B.Com. is on 2nd top of the list with 2,582 students. The ratio of male-female student is 68:32. MBBS has total number of 2123 students with the higher percentage of female students (55.8%). B.Pharma has 2051 students with 74% male students. There are 1989 foreign students enrolled in B.Sc. out of which 64.1% are male students. BA has total number of 1959 students with 56.6% of male students. BCA has total number of 1921 students with 83% of male students. There are 1746 students enrolled in B.E. out of which 85% are male students. B.Sc. Nursing has 1583 students with the female percentage as 97.1%. BBA has total number of 1494 students out of which 66.3% are from male category. There is total number of 530 students enrolled in LLB with 54.2% male students. At the Post Graduation level, 1424 students are enrolled at M.A. level with 64.8% male students. M.Sc. has reported enrolment of 1483 students with 76.5% of male students. MBA has reported the enrolment of 1184 foreign students with 67.7% of male students. M.Com has total number of 227 students with 171 male students. At Ph.D. level, there are 908 students with male and female ratio of 68:32.
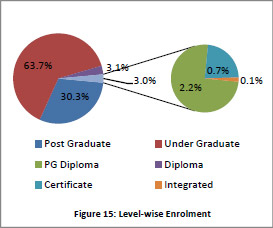
2.2.9 Enrolment in Distance Mode
Looking at the State-wise variation, out of the total reported enrolled students pursuing studies through distance education, 6 States of India are providing education to around 73% of the students. These are Tamil Nadu with 19.1% of students, Andhra Pradesh with 16.8%, Delhi with 14.9%, Maharashtra with 10.8%, Karnataka with 6.4% and Madhya Pradesh with 5.4% of the share of students enrolled through Distance mode.
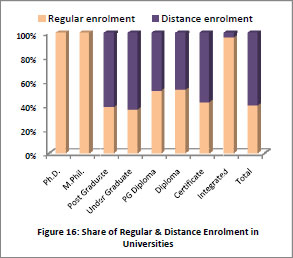
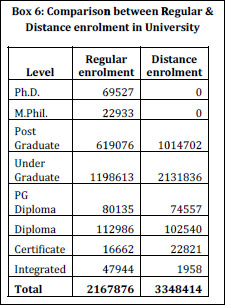
Distance Mode is mainly conducted by University and majority of the students (61%) enrolled in Universities and their Constituent units are studying under distance mode which can be seen from the adjacent table. At Post Graduate, Under Graduate, PG Diploma, Diploma and certificate level share of distance enrolment in university is 62%, 64%, 48%, 48% and 58% respectively. Distance enrolment at Integrated level is negligible. |
||||||||||||||||||||||||||||||||||||||||||||||||||||||||
2.2.10 Enrolment in Stand-Alone Institutions There is total number of 11,126 Stand Alone Institutions in India distributed with high variations among States. Type-wise distribution is shown in the Table 9. Out of 18,14,221 enrolled at several courses at stand-alone institutions 67% are males and 33% are females. Stand Alone Institutions are primarily meant for providing Diploma programmes.
The total number of Nursing Institutions is 2577 and out of them only 1310 responded with the data which is 51% response rate. The total enrolment in nursing course is 1.53 lakh and out of them 84.65% are female students and 15.35% are male students. Top 3 States are Karnataka, Andhra Pradesh and Kerala are contributing 72% of the students out of the total students enrolled in India for nursing. Karnataka has the highest number of students enrolled in nursing course with 48,249 students, followed by Andhra Pradesh with 44,423 students and Kerala with 17,223 students. Karnataka has the highest number of students enrolled in nursing course with 70.8% of female students; Andhra Pradesh has 97.02% of the female students. Kerala has 96.02% of the female students enrolled in nursing course which are highest in these top 3 States.
2.2.11 Representation of Private Sector There are more than 70% colleges running in Private sector; aided and unaided taking together, but it caters only 62% of the total enrolment. It shows lower per college enrolment in private sector. State-wise enrolment in Private and Government Colleges as per response is given in Table 5(a).
2.3. GROSS ENROLMENT RATIO IN HIGHER EDUCATION (18-23 Years)
|
||||||||||||||||||||||||||||||||||||||||||||||||||||||||
 |
||||||||||||||||||||||||||||||||||||||||||||||||||||||||
| 2.4 TEACHING STAFF
The total number of teachers have been estimated to be 12,47,453 . Out of which more than half about 61% are male teachers and 39% are female teachers. The lowest gender proportion is recorded in Bihar where female teachers are more than 4.11 times lesser than the male staff 80.45% male and only 19.55% female teachers are reported; Arunachal Pradesh comes close second with 75.5% male teachers and 24.5 % female teachers, that is, more than 3 times lesser than the male staff. Odisha, West Bengal, Jharkhand and Uttar Pradesh have only 30% (approximately) female staff of the total teachers available in States. A few States Delhi, Chandigarh, Goa, Kerala and Meghalaya on the other hand have more female teachers than male teachers.
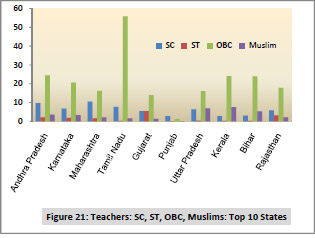
In terms of caste and religious minorities’ representation in teachers in varsities in India, the distribution is considerably leaning towards one category. At All-India level, teachers belonging to General category are more than half, that is 69.1% of the total number of teachers in India; OBC follows with 22.0%; while SC and ST with 6.9% and 2.0% respectively (Figure 20). Merely 2.9% teachers come from Muslim minority group, and 3.01% are other minorities. State-wise number of Teachers in various Socio-religious categories is given in Table 21 (a) and 21(b).
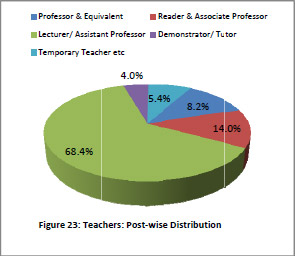
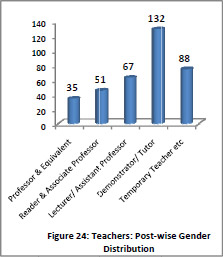
Among various levels of posts, majority of teachers are of the level of Assistant Professor, followed by Associate Professor. The distribution is shown in Figure 23 and the number of female teachers per 100 male teachers at various levels is shown in Figure 24. The state-wise number of teacher at various levels with male and female wise break-up in responding institutions are given in Table 22. The higher the post, lower representation of female is clearly seen from the Figure. |
||||||||||||||||||||||||||||||||||||||||||||||||||||||||
  |
||||||||||||||||||||||||||||||||||||||||||||||||||||||||
The number of total teachers at University level is around 1.33 lakh out of which 68% are males and 32% are females. At college level, the number of teachers is 9.9 lakh with 60% of male teachers. In Standalone institutes, total number of teachers is 1.25 lakh with 59.96% male teachers. Looking at female per 100 male teachers, there are 39 teachers at University level, 63 female teachers per 100 male teachers at college and Stand Alone Institutions each.
|
||||||||||||||||||||||||||||||||||||||||||||||||||||||||
|
Among top 6 States in terms of Enrolment, Uttar Pradesh has the highest PTR (30) followed by Maharashtra (22). State-wise details of PTR are given in Table 25. As regard to Type of University lowest PTR is observed in Government Deemed University (8) and higher than 50 in case of Central and State Public University. University Type wise detail is given in Table 31. 2.5. NON-TEACHING STAFF
In group-wise posts, the non-teaching staffs have more male members in each group as shown in Figure 28. There are 70% males and 30% females in Group-A. Though the numbers are different in Group-B, the percentage distribution is the same. In Group-C the male share is 74 % as against 26% females, while in Group-D there are highest male staff members with 77% but only 23% females. In U.P. the male staff share is the highest with 84% and only 16% females, while Gujarat is close second with% male staff and 20% female staff. Maharashtra is closely behind with 80% male staff and 20% female staff. Tamil Nadu also has a higher share of male staff with 62% and 38% females. Karnataka comes sixth in this ratio share with 65% male and 35% female staff posts. This same picture is reflected in the group-wise break up of data. Inversely, in Puducherry in Group-A female non-teaching staff is 53% slightly higher than male staff 47%. In Arunachal Pradesh in Group-A the ratio male: female is 18:1, while in Sikkim there are no females and only 6 male non-teaching staff posts. In Group-B and C Goa has a few numbers of female non-teaching staff higher than the male staff while Group-D has only male staff higher than female staff in all the States and Union Territories of India. State-wise number of non teaching staff in different groups in responding Institutions is given in Table 23.
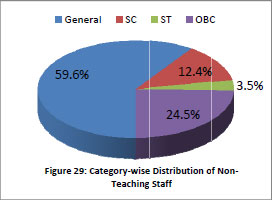
In regard to Social category, 59.6% non teaching staffs are from General category, 24.5% are from OBC, 12.4% from Scheduled Caste and 3.5% are from Scheduled Tribe. State-wise number of non teaching staff in different categories in responding Institutions is given in Table 24.
2.6. OUT-TURN/EXAMINATION RESULT 2.6.1 Level-wise Out-Turn (Based on Actual Response)
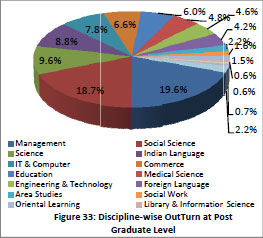
2.6.2 Programme-wise Out-Turn (Based on Actual Response)
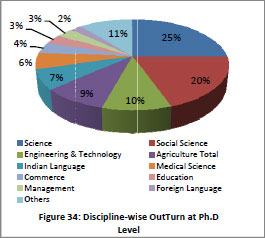
At Ph.D level, maximum number of students out-turn is in Science stream (5393) followed by Social Science (4215). On the other hand at PG level maximum students out-turn is observed in Social Science stream (2.09 lakh) and Science comes at number two with 1.06 lakhs students. In Engineering & Technology and Medical Science stream out-turns are 51895 and 54043 students respectively. It is interesting to note here that at Under Graduate level ratio between these two streams is 3:1 whereas at PG level it becomes 0.96:1. Enrolment in major discipline/subject at Ph.D, PG and M.Phill level based on actual response is given in Table 37.
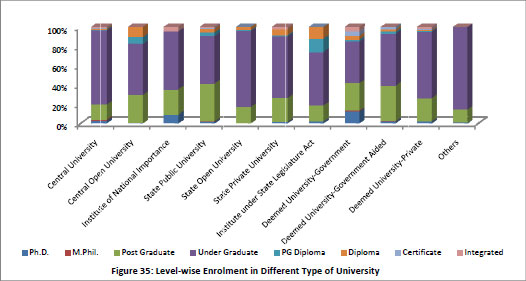
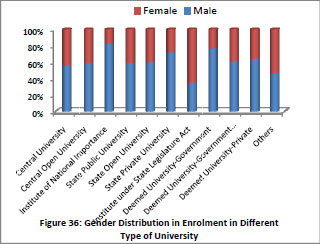
2.7. ENROLMENT IN DIFFERENT TYPES OF UNIVERSITIES There are 11 types of universities and the level wise enrolment each type of universities, teaching departments and constituent universities/off-campus centres are given in Table 26. Total numbers of students enrolled are 55.2 lakhs. In Institutes of National Importance and Government Deemed universities share of Ph.D. students are large. Share of female students is lowest in Institutions of National Importance followed by Government deemed universities are State Private Universities whereas the share is highest in Institutes under State Legislature Act. Share of female students in Central and State Public Universities are approximately 45%.
Level-wise enrolment in affiliated and constituent colleges of Central and Open universities are given in Table 26B. Categories wise enrolment in various types of universities is given in Table 27. In Table 28 enrolment in PWD and minority enrolment in various types of universities are given. There are wide variations in representations of different categories in various types of universities. In State Open Universities representation of SC/ST/OBC and General is high as shown in the chart.
There are 1.33 lakh teachers in various types of University/Teaching departments and their constituent units/off-campus universities, out of them 42.8 thousand are female. Among various types of universities, Private universities in general have larger proportion of female teachers. In State Public universities, the proportion of undergraduate enrolment is less than 50% whereas in the Central universities it is more than 75%.
CHAPTER 3 – ESTIMATION METHODOLOGY
College means any Institution, whether known as such or by any other name which provides for a course of study for obtaining any qualification from a university and which, in accordance with the rules and regulations of such university, is recognised as competent to provide for such course of study and present students undergoing such course of study for the examination for the award of such qualification. These are the institutions established or maintained by or admitted to the privileges of the University.
|
||||||||||||||||||||||||||||||||||||||||||||||||||||||||
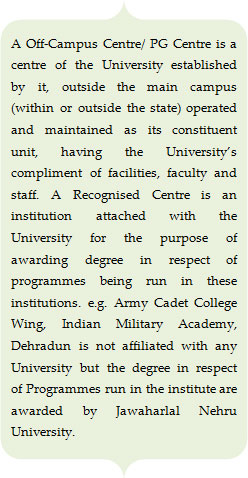
Colleges, the Affiliated Colleges and the Off-Campus Centres were required to fill DCF-II. Constituent units of University, primarily of Private and Deemed Universities, which are integral part of University, have also been listed by these Universities as Constituent College. However, DCF-II for such units were not required to be filled. For Recognised Centres, in normal cases, DCF-II have not been filled, but in a few cases where these are independent institutions, DCF-II have been filled.
In bracket, numbers of such institutions during AISHE 2011-12 are given. State-wise number of colleges of different types is given in Table 38.
Although intended to cover the entire population, approximately 60% colleges’ data could be collected and thus to have an idea of total College’s enrolment and number of Teachers, estimation adopting proper sampling methodology, was required. Constituent Colleges are mainly located in Bihar, Jharkhand and Maharashtra and most of them have uploaded the data. Therefore, enrolment and teachers for Constituent Colleges including constituent units of University has not been estimated For PG/Off-Campus Centres and for Recognised Centres also no estimation has been made. During 2011-12 survey, DCF-II for only PG/Off-campus centres and Recognised centres have been filled.
Thus for only affiliated colleges, enrolment and number of teachers has been estimated based on the Stratified Sampling technique. Post-Stratification has been done, after the survey for the year 2011-12 is closed.
|
||||||||||||||||||||||||||||||||||||||||||||||||||||||||
 In Gujarat and Chhattisgarh Polytechnics have been affiliated with the University and therefore they have not been counted as Stand-Alone Institution. The Polytechnics in these 2 States have been included in the Colleges. For the first time, Institutes under direct control of Central Ministries were identified and attempt was made to capture them in the survey.
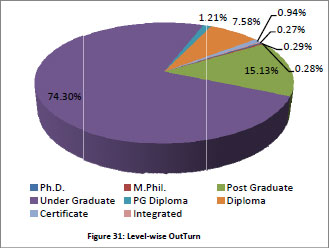
 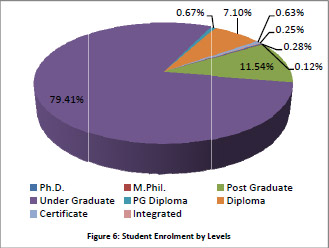 Total Student enrolment has been classified in 8 levels across all the States of India viz – Ph.D., M.Phil., Post Graduate, Under Graduate, PG Diploma, Diploma, Certificate and Integrated. Percentage share of student enrolment in these levels are shown in Figure 6. State-wise and level-wise estimated enrolment is given in Table 6 estimated enrolment in Regular Mode is given in Table 6 (a).
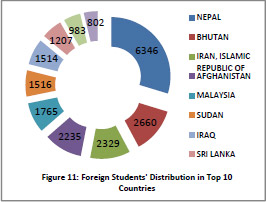 The total number of foreign national students enrolled in Indian Universities and Colleges are 33,151. Country-wise and level-wise foreign students in responding Institutions are given in Table 16. The foreign students come from 155 different countries from all across the globe. The top 10 countries of the foreign students are as in Figure 11. These 10 countries constitute 64% of the total foreign students enrolled. Rest of the 36% students comes from remaining 145 countries. Highest share of students come from the neighboring countries of which Nepal is 19% of the total, followed by Bhutan (8%), Iran (7%), Afghanistan (6.7%), Malaysia (5%). Sudan and Iraq constitutes 4.6% each and Sri Lanka, United States and UAE, constitutes 3.6%, 3% and 2.4% of the foreign students respectively. Moreover, among major contributors, only 2 countries Malaysia (61.8%) and Sri Lanka (56.4%) have more female students than male. United States and Iran have almost an equal share of male and female students. On the other hand, Afghanistan (88%), Sudan (91.8%) and Iraq (89.5%) have a considerably higher number of male students. Although maximum number of foreign students comes from Nepal, the maximum number enrolled in Ph.D is from Iran.
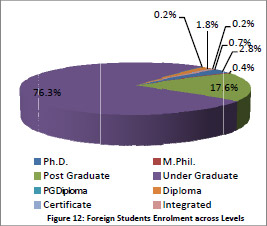
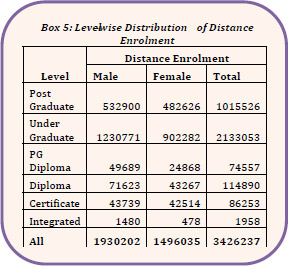 Distance education has become one powerful medium of obtaining degrees for huge number of students who are staying in far off and remote areas and for whom accessing universities on regular basis is still a dream. Distance enrolment constitutes 11.7% of the total enrolment in higher education, of which 43.7% are female students. Level wise distribution of students under distance mode is given in the adjacent table. At all Levels share of male student is higher than females.
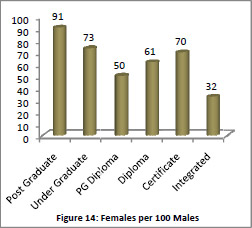
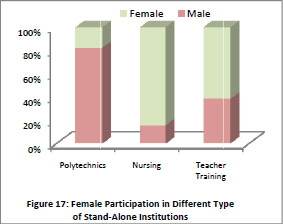 There is total number of 3287 Polytechnics in India and out of them 2133 reported the data during the survey. The highest number of Polytechnics is in Maharashtra which is 1055 and out of them only 614 responded. There is total number of 12.77 lakh students enrolled in Polytechnics and out of them 82.35% are male students and the remaining females with very less participation of around 17%. There are seven States which have total number of 10.82 lakh of students in Polytechnics which makes it to 85% of the total students enrolled in India in Polytechnics. These states are Tamil Nadu with 3.67 lakh students, Maharashtra with 2.51 lakh students, Karnataka with 1.56 lakh students, Punjab with 91,701 students, Andhra Pradesh with 80,295 students Haryana with 71,291 students and Odisha with 64,932 students,. The number of male students is 3.33 lakh which is 90.8% of the total students enrolled in Polytechnic courses in Tamil Nadu which is highest from these top 7 States. The State at the second top is Maharashtra with the enrolment of 2.51 lakh students out of which 73.46% are male students. Karnataka has 77.2% of male students and 22.8% of female students from the total number of students enrolled which is 1.56 lakh. Punjab has recorded 91,701 students in Polytechnic courses with 86.93% of male students. Odhisa has 86.62% of male students, Andhra Pradesh has 74.14% of the male students and Haryana has 90.17% of the male students.
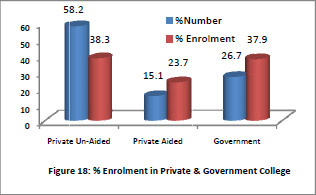
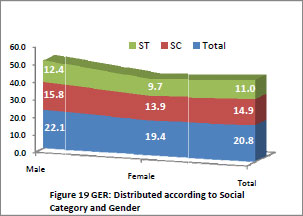 Gross Enrolment Ratio (GER) in Higher education in India is 20.8, which is calculated for 18-23 years of age group. For Scheduled Castes it is 14.9 and for Scheduled Tribes it is 11% as compared to the national GER of 20.8.
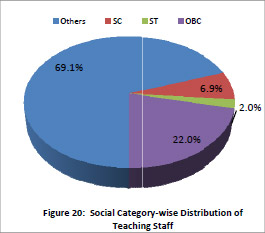
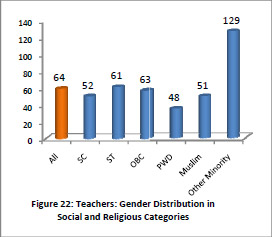 As mentioned above, another significant representation in terms of gender distribution is the number of female teachers per 100 male teachers. At the all-India level there are merely 64 female teachers per 100 male teachers. Similarly, in SC category the female staff is only half that is 52 per 100 males; ST and OBC are same as total across India with 61 and 63 females per 100 males respectively. The Muslim minorities are only 51 female teachers per 100 male, but other minorities are inversely higher with 129 females per 100 male teachers. However, it is to be noted that female representation in teachers belonging to Persons with Disabilities (PWD) category is very low, that is, only 48 females per 100 male teachers.
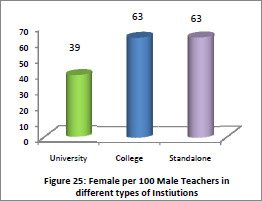
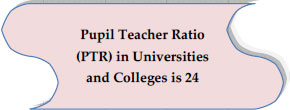 Taking into account all types of Institutions (University, Colleges & Stand-Alone Institution), Pupil Teacher Ratio (PTR) at All India level comes out to be 23 and 21 if only regular enrolment is considered. In case of University and its Colleges PTR is slightly higher (24) whereas it is same if only regular mode students are taken. It has been observed that, PTR in University alongwith its Constituent Unit has improved significantly (16) in case of Regular Mode. However, it is very high (42) if Distance Enrolment is also taken. Looking at the State-wise variation, it is seen that there are a large variation among States. PTR is less than 10 in Dama & Diu and Puducherry and more than 40 in Bihar and Jharkhand.
 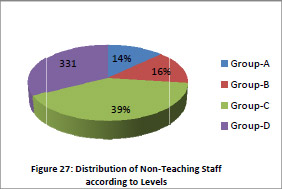 The non-teaching posts in responding Institutions are 8,00,934 and are divided into four groups – A, B, C and D. The share of Group-C is the highest with 39%, while Group-D seconds it with 33 %. Group-A and Group-B comprise of 14 and 16 per cent non-teaching posts respectively (Figure 27).
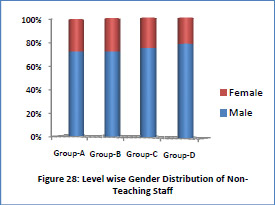
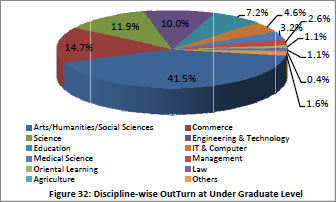 The total number of pass-outs at Undergraduate Level in major discipline/subject based on actual response is given in Table 36. The highest number of students has been graduated in Arts/ Humanities/ Social Sciences courses. The total number of students passed-out in this are 22.7 lakh out of which 47% are males and 53% are females. Commerce is second major stream with 8.03 lakh students passed-out followed by Science with 6.52 lakh students. 5.5. lakh students have been graduated in Engineering and Technology stream. In Medical Science stream, there are 1.73 lakh students who have been awarded Under Graduate degree.